Iran Strikes Hit BTC, $958.8M Burns

Crypto dropped the breakfast tray, and BTC was standing right underneath it.
Verified U.S. strikes near the Strait of Hormuz sent traders into panic mode, and the result was ugly: BTC at $73,126 (-1.21%), ETH at $1,983.34 (-1.51%), and $958.8M in liquidations. The key continuity shift is simple: BTC lost $75,000 and fell back into the $73,000-$74,000 downside zone, while ETH lost both $2,052 and $2,000.
TODAY'S BOARD
BTC $73,126 — $75K broke and downside discovery is back on the plate
ETH $1,983.34 — Lost $2,000 and still looks undercooked
Flow Signal — $733.43M ETF outflow — Institutional support picked a rough day to leave
TODAY'S JOB
Watch whether BTC can reclaim $75K and whether ETH can climb back above $2,000 before calling this flush finished.
Market Snapshot
BTC: $73,126 (-3.66%) | Lost $75,000 and dropped back into the $73,000-$74,000 downside zone.
ETH: $1,983.34 (-5.11%) | Broke $2,052 and lost the $2,000 floor.
Fear & Greed: 22 (Fear) ← 25 | Sentiment is hiding in the walk-in freezer.
Levels to Watch
BTC — 4H: Dropped the Plate, Watching $73K for a Save
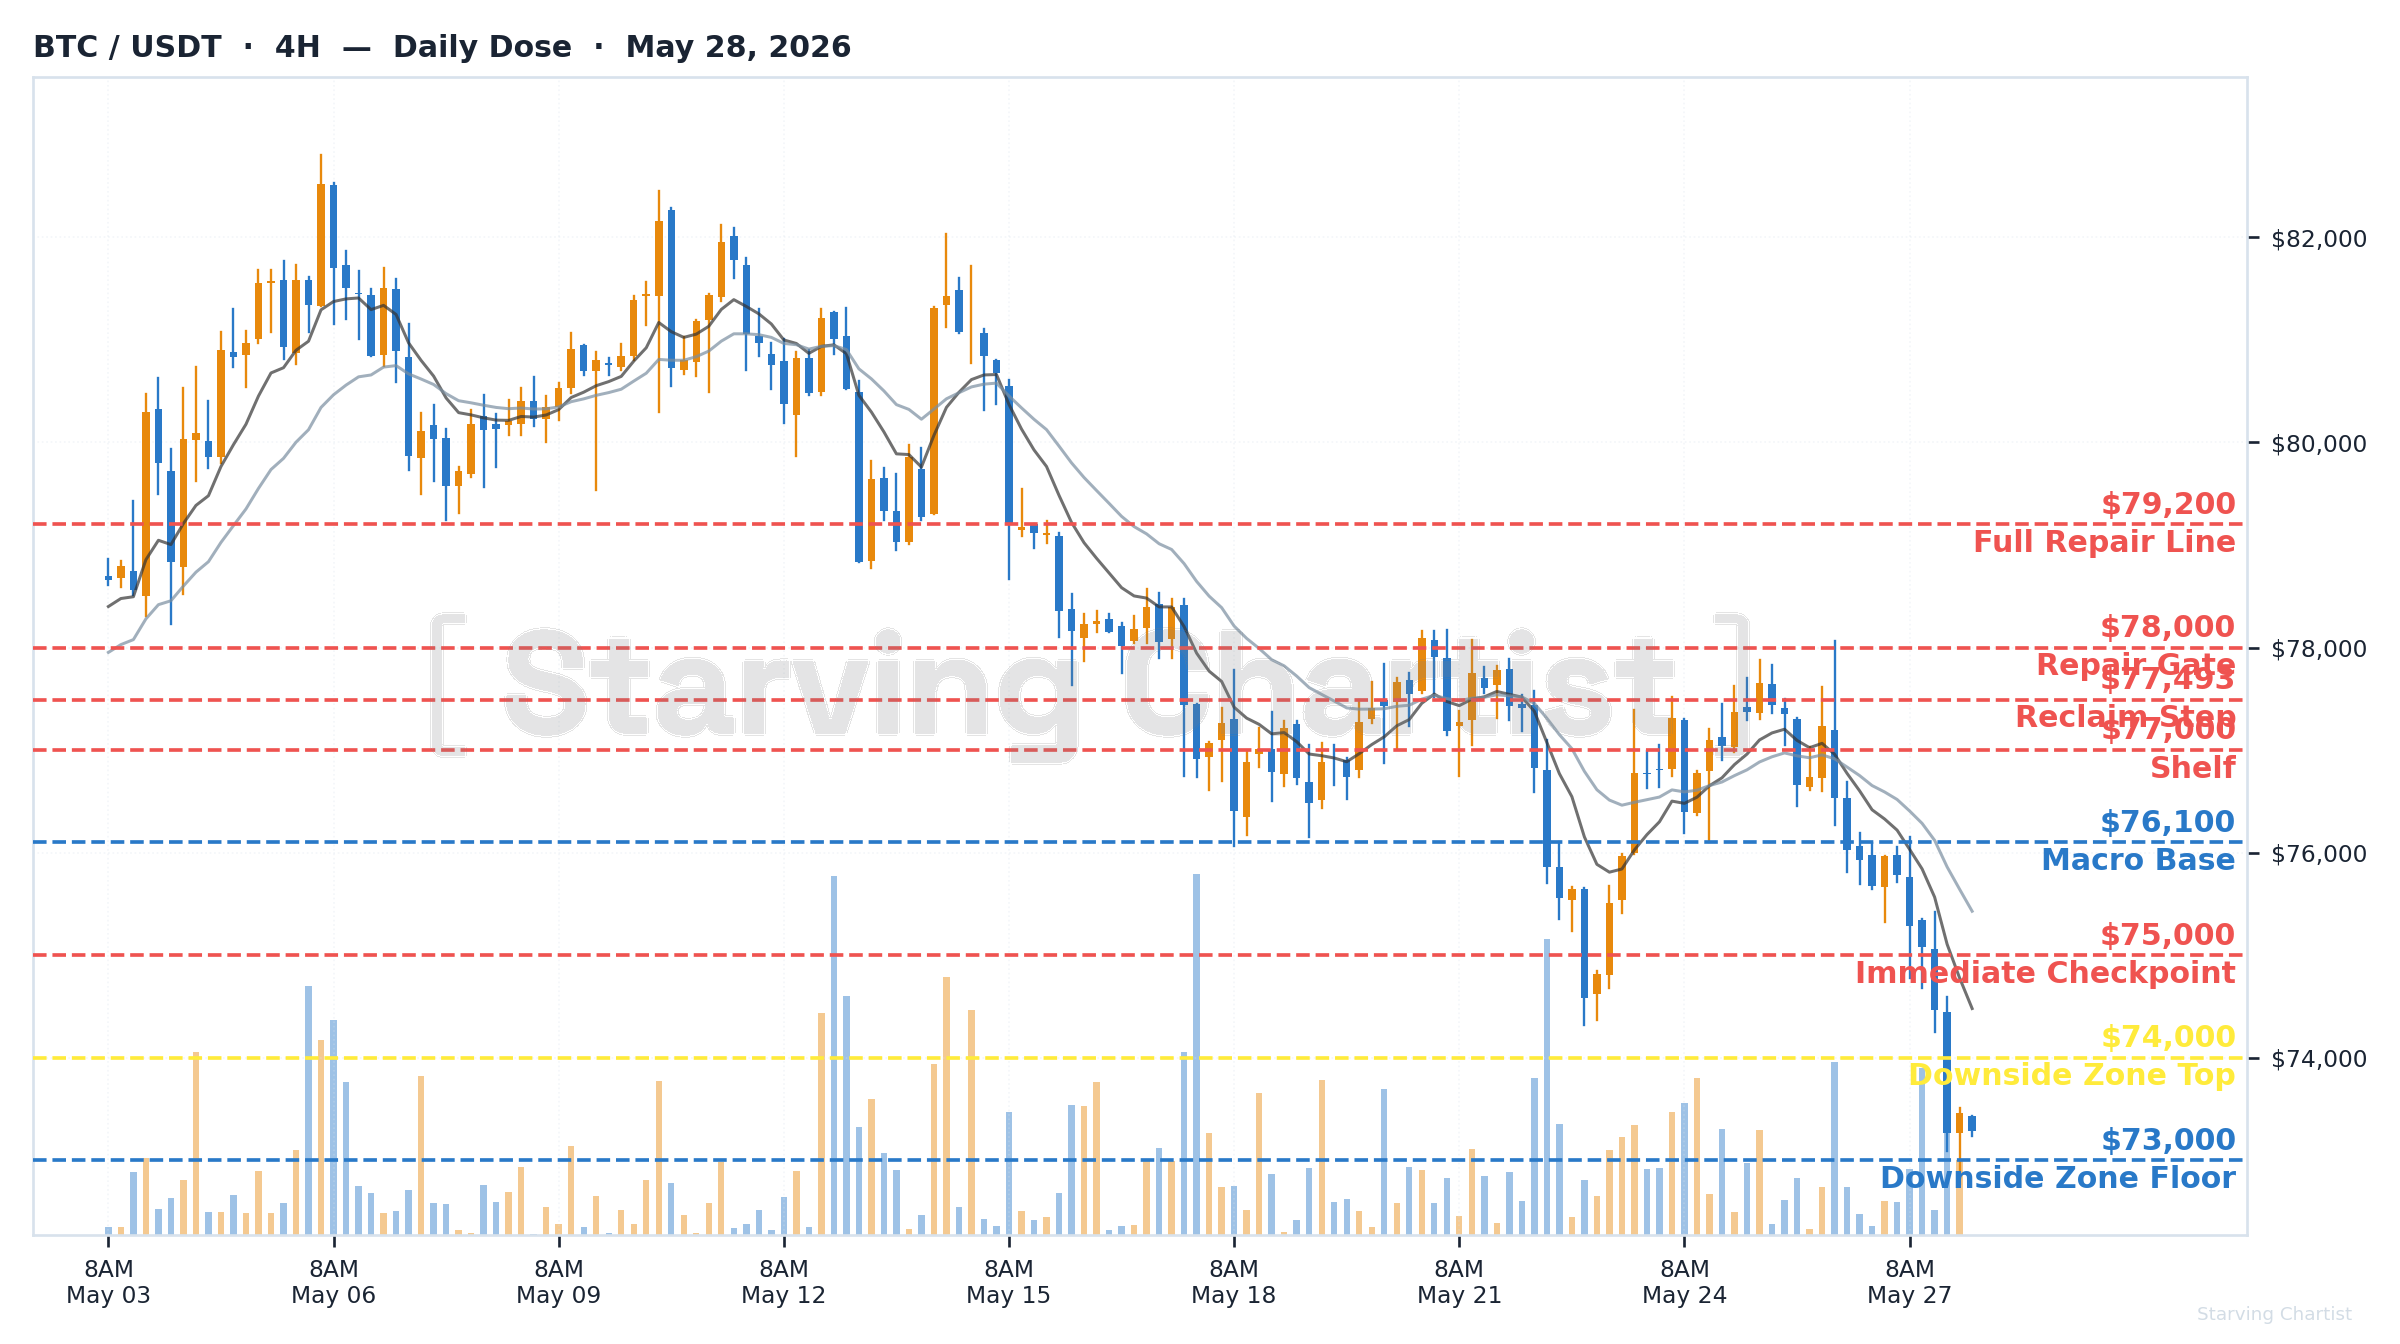
Yesterday's Tape: -1.97% (O: $75,821 | H: $76,037 | L: $74,127 | C: $74,330)
Support $73,000: Tested ⚡ — current session low hit $72,712, then price bounced back inside the zone.
Resistance $76,100: Broke ✗ — yesterday's must-hold base is still lost and current price is $2,974 below it.
Bias: Bearish
ETH — 4H: $2K Cracked — Panic Hit the Kitchen
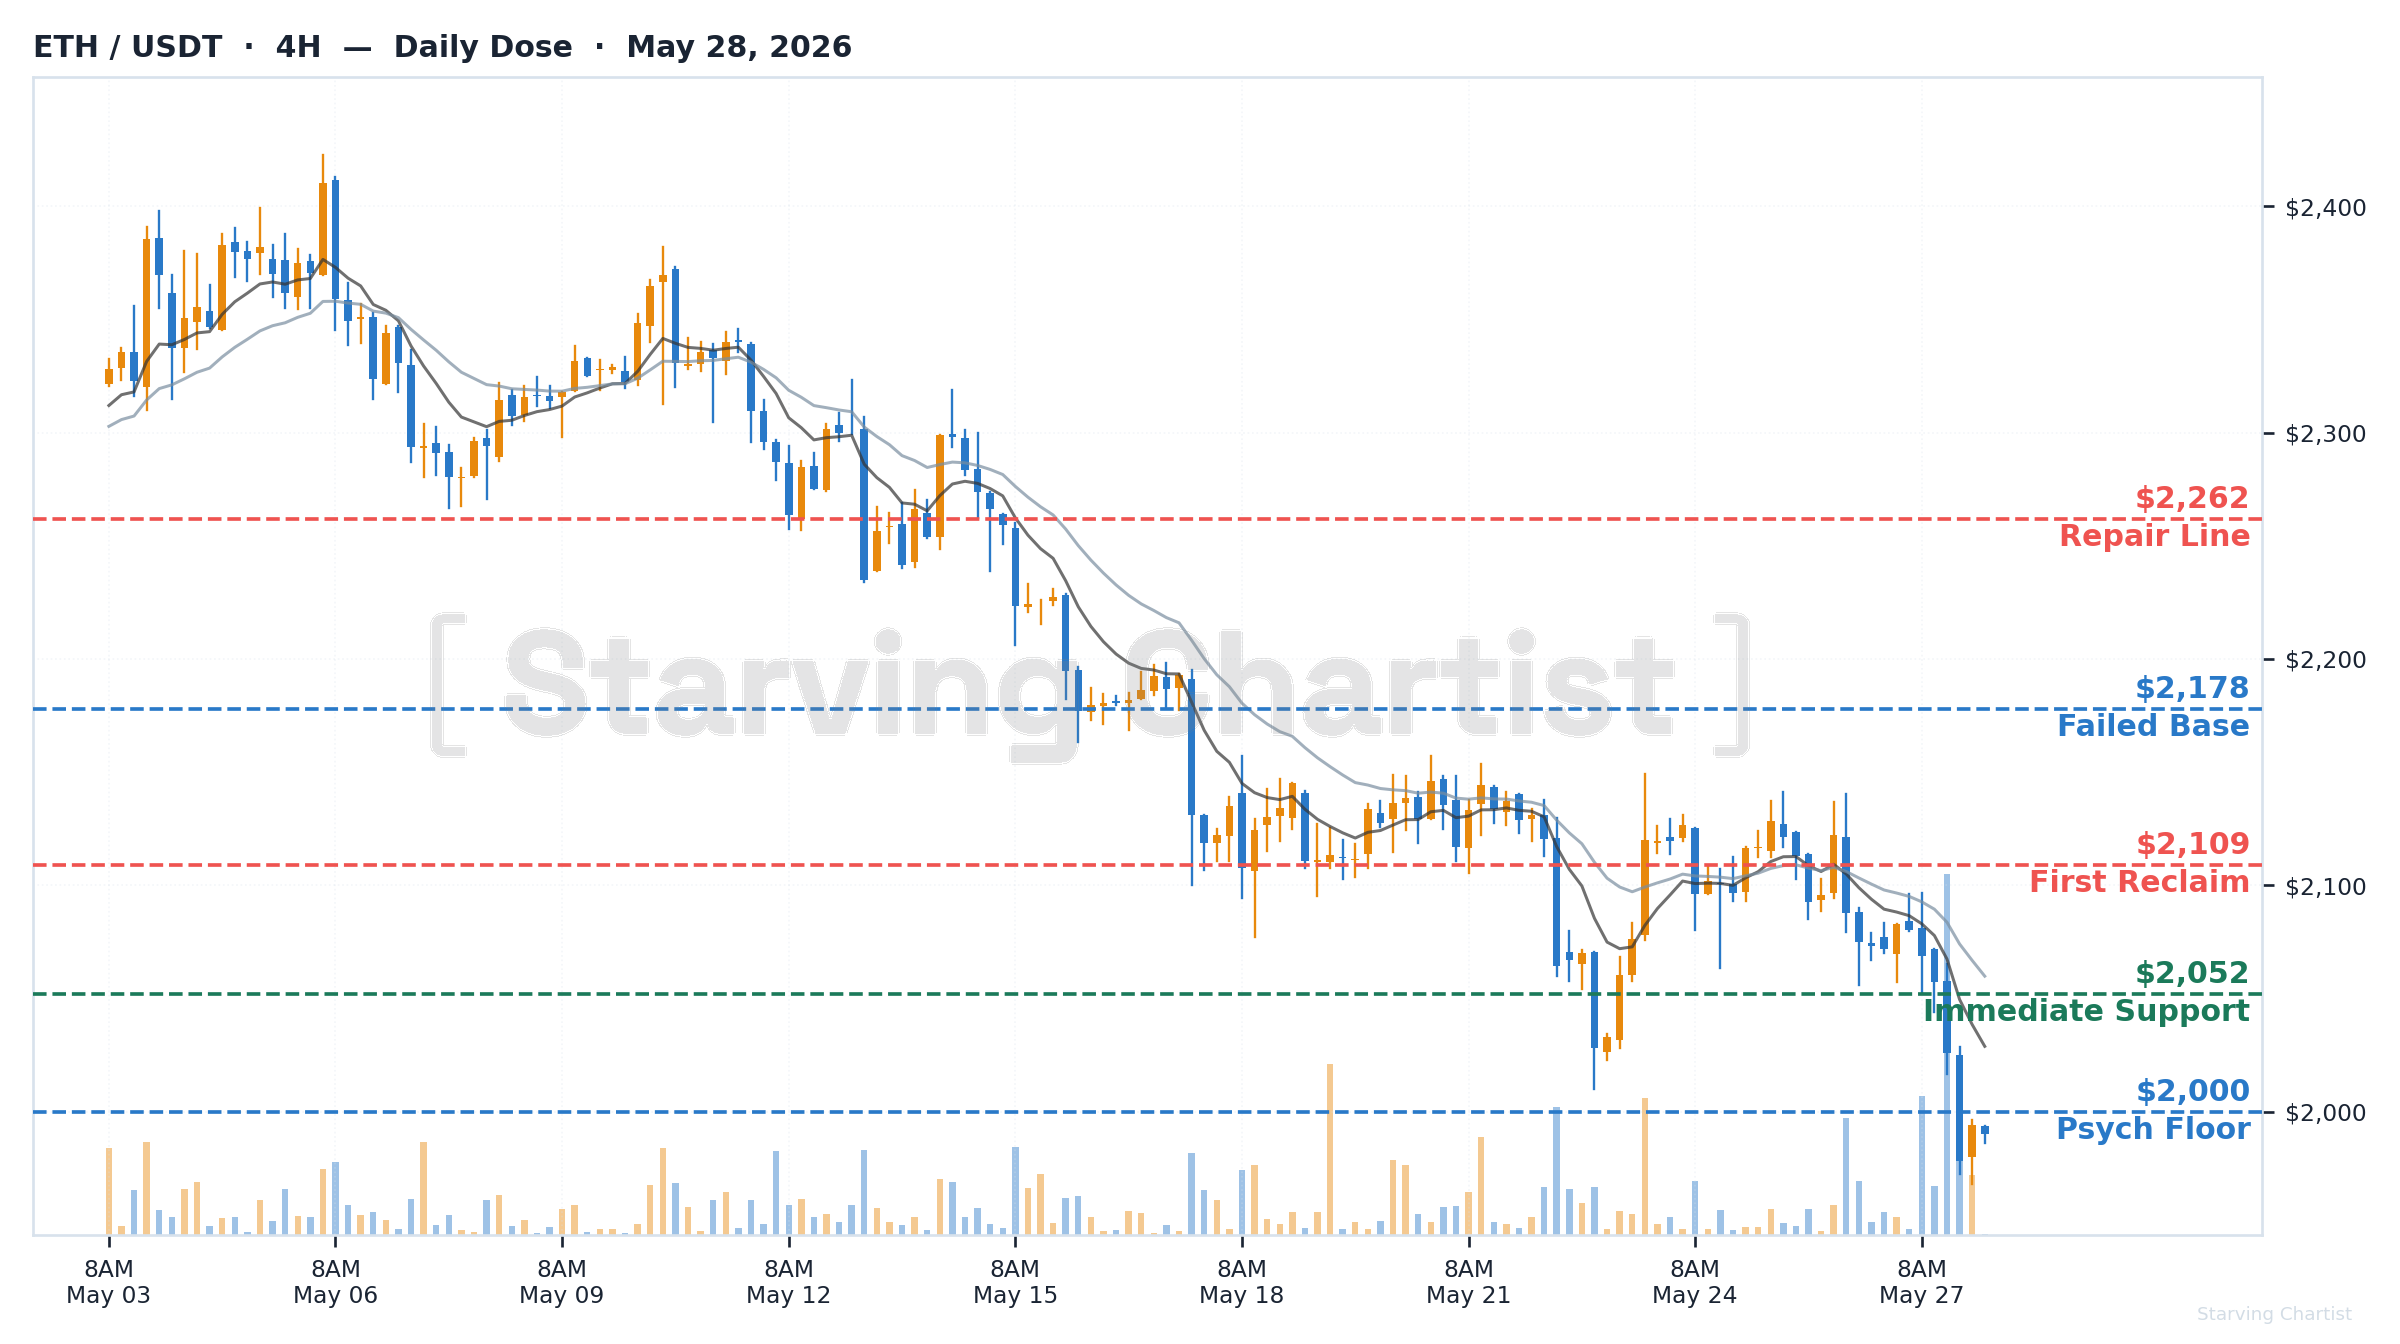
Yesterday's Tape: -2.36% (O: $2,072 | H: $2,091 | L: $2,012 | C: $2,022)
Support $2,000: Broke ✗ — the psychological floor failed; current price is $16.66 below it.
Resistance $2,109: Broke ✗ — this is still the real repair line and price sits $125.66 below it.
Bias: Bearish
Core Setup — Hormuz Shock Broke Support and Put the ETF Floor on Trial
Verified U.S. strikes near Hormuz hit a market that was already wobbling, and crypto folded fast. BTC lost $75,000 and dropped back into the $73,000-$74,000 zone, while ETH lost $2,052 and the $2,000 floor. That's the part that matters most this morning.
The other problem is the support cast: $958.8M in liquidations and $733.43M in spot BTC ETF outflows tell you this wasn't just a random bad candle. The flush got real help. Paid readers get the full level map, macro breakdown, and game plan from here.
🔑 Quick Hit
MACRO — Dollar Back on the Menu | DXY firmed while oil jumped, which is exactly the kind of combo that makes risk assets eat glass.
🔓 Unlock the Full Setup
You just got the appetizer. The full menu is waiting.
📊 Full level maps with annotated charts
🌎 DXY + macro cross-asset breakdown
🎯 The Game Plan — conviction, upside path, invalidation, catalyst
⚡ 3 Quick Hits you won't find this fast anywhere else
🔮 Bull/base/bear probability splits with real percentages
🍽️ The full Starving Chartist experience
what should we serve more of?
food is better with friends. 2 referrals = one month premium. on the house.
your invite link is below. copy it and pass it along to share the table:
{{rp_refer_url}}
NFA as always — Stay Fed. 🦞
Starving Chartist · Daily Dose · Free · May 28, 2026